
 sending...
Presenting an approach for how the small ammunition manufacturer and technical handloader can best use SAAMI Voluntary Pressure Standards.
J. A. Smith
The small ammunition manufacturer and the serious handloader are more and more able to get reasonably accurate chamber pressure readings from strain gage pressure test equipment. It is all too easy to shoot a five or ten shot string, compute an average from the readings and call that one’s pressure. What does that average really suggest in terms of balancing safety against performance? We show how one can relate these results to the SAAMI Pressure standards.
Nearly all of us face big challenges in wrapping our minds around the meaning of pressures when determining safe loads. What does it mean when the cartridge has a SAAMI Maximum Average Pressure or MAP of 52,000 psi? Why should we use a 50,000±500 psi working pressure to define our maximum recommended loads for that cartridge?
Most of us rely on published handbooks to infer pressures, but the reality is that the listed pressure is an average value based on a number of tests by the publisher’s laboratory. Statistical behavior guarantees that the true average pressure in their test hardware is different than the measured average. This brief note explains the statistics behind this value and how it applies to the real world.
In the table below, SAAMI lists the MAP as 520 (x100 psi), or 52,000 psi. This specification is also defined with a 4% standard deviation from the average pressure. This means that the true average pressure of a load tested with one five-shot string will be different than the measured average. In other words, a load producing a pressure measurement of 50,000 psi with a five-shot string will have a true average greater than 52,080 psi about 2 times out of 100 tests. The MAP value was established by SAAMI to be the maximum average pressure for commercial load development.
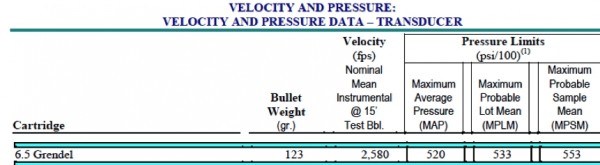
Figure 1. Typical Cartridge performance description.
Because it is impractical to obtain the true average for a given set of loads (you would have to shoot all of them), SAAMI established guidelines to assure safety when a cartridge manufacturer develops a load within the MAP and subsequent testing of production lots. The Maximum Probable Lot Mean (MPLM) and the Maximum Sample Probable Mean (MPSM) are used for assessing whether a particular lot of ammunition can be accepted or rejected. Our principal concern in this paper is load development rather than process control. Should you be interested in learning more about MPLM and MPLSM, try a Google search for “SAAMI Standard – 206(1)” and the first item popping up will likely be a downloadable PDF of the standard.
SAAMI used another term of statistics, the standard error in defining the MAP. Where standard deviation is a term that represents the spread, or degree of variation, of the values in a set of measurements from the average of that set; standard error is an expression for the deviation of the average of a given set of measurements from the average of the total population (if the total population was measured). The main difference between these two terms is that the standard deviation is not as dependent upon sample size. Standard error, which is calculated by dividing the standard deviation by the square root of the sample size, will become smaller as the number of samples increases. For a SAAMI-defined MAP of 50,000 psi, the standard error is 658 psi when 10 shots are measured, and 930 psi if only 5 shots are measured.
We recommend using the Standard Deviation and Standard Error as defined in the SAAMI standard rather than distributions derived by the small ammunition manufacturer or serious handloader. Part of the reason for this choice is that the SAAMI guidelines are based on a very large experience base in contrast to the very limited number of tests we are able to generate. This means that, should a particular 5- or 10-shot string exhibit very uniform performance, the large-scale average may not be as uniform. Conversely, a load that has erratic pressure performance over a small sample size may not be representative of the entire set of potential rounds made to that prescription.
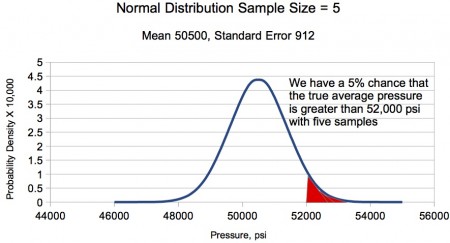
Figure 2. The normal distribution shows that by adopting a maximum working pressure of 50,000±500 psi and 5-shot strings, we have a 5% chance that the true average pressure exceeds the SAAMI maximum pressure exceeds 52,000 psi.
Because the standard error is a function of the sample size, small sets of data can be collected to produce useful conclusions. For example, the bell curve in Fig 2 is representative of a five shot string producing an average of 50,500 psi. The curve represents the probability density for the standard error for five shots and the SAAMI guidelines. We see that there is about a 1 in 20 chance that the true average pressure for our load is above the 52,000 psi MAP.
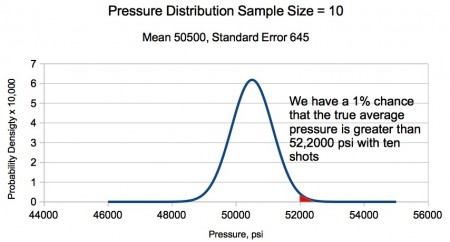
Figure 3. The normal distribution shows that by adopting a maximum working pressure of 50,000±500 psi and 10-shot strings, we have a 1% chance that the true average pressure exceeds the SAAMI maximum pressure exceeds 52,000 psi.
On the other hand, if we shoot a 10-shot string, Figure 3 shows that we have about a 1 in 100 chance of the true average pressure of the load exceeding the 52,000 psi MAP and a vanishingly small chance of having a load that threatens bolts or safety.
By selecting a working pressure of 50,000 ±500 psi and using 5, 10 or more shots to define maximum recommended loads, we have a reasonable expectation that our true average pressure will be less than the 52,000 psi in almost all cases. The margin also helps keep pressure down when other chambers might have different dimensions affecting bullet jump and pressures. To be sure, a bit more velocity can be squeezed out by a more aggressive approach, but the added velocity has a very small effect on trajectories, wind drift, and reliable hunting bullet function.
# # # #
The author deeply appreciates contributions by 65Grendel.com participant rickOshay and Ammoguide member tloc54 that helped make this paper more effective than it might otherwise have been.